Article contents
- Evidence and scope
- Illustration
- Process
- A higher price is not necessarily a more prominent peak
- A local detector with a finite confirmation delay
- Height, threshold, prominence and width answer different questions
- Numerical examples, rejected ripples and losing trades
- Use prominence as an anchor feature before inventing an entry
- Let volume test a distinct contribution
- Validate geometry, stability and economic value separately
- Common pitfalls
- Practical checklist
- Frequently asked questions
- Research sources
Evidence and scope
The three references are official SciPy API documents supporting definitions and implementation behavior. They provide no evidence that a trading strategy built from these features is profitable.
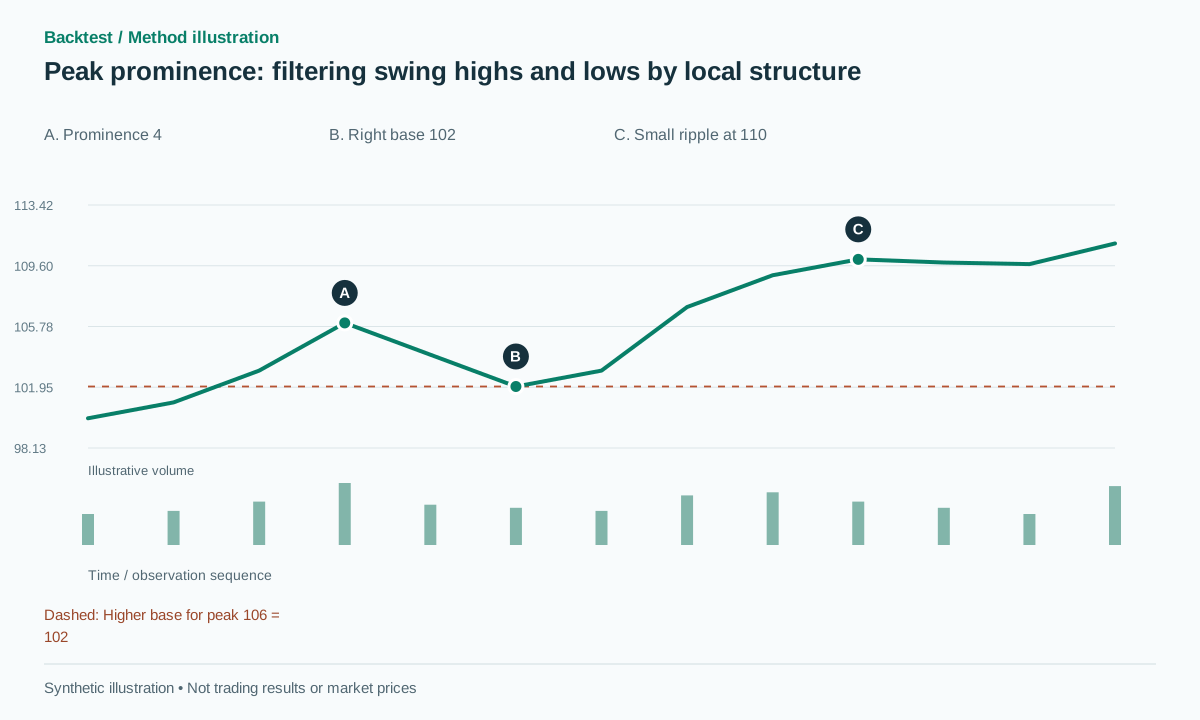 Open full-size illustration
Practical workflow
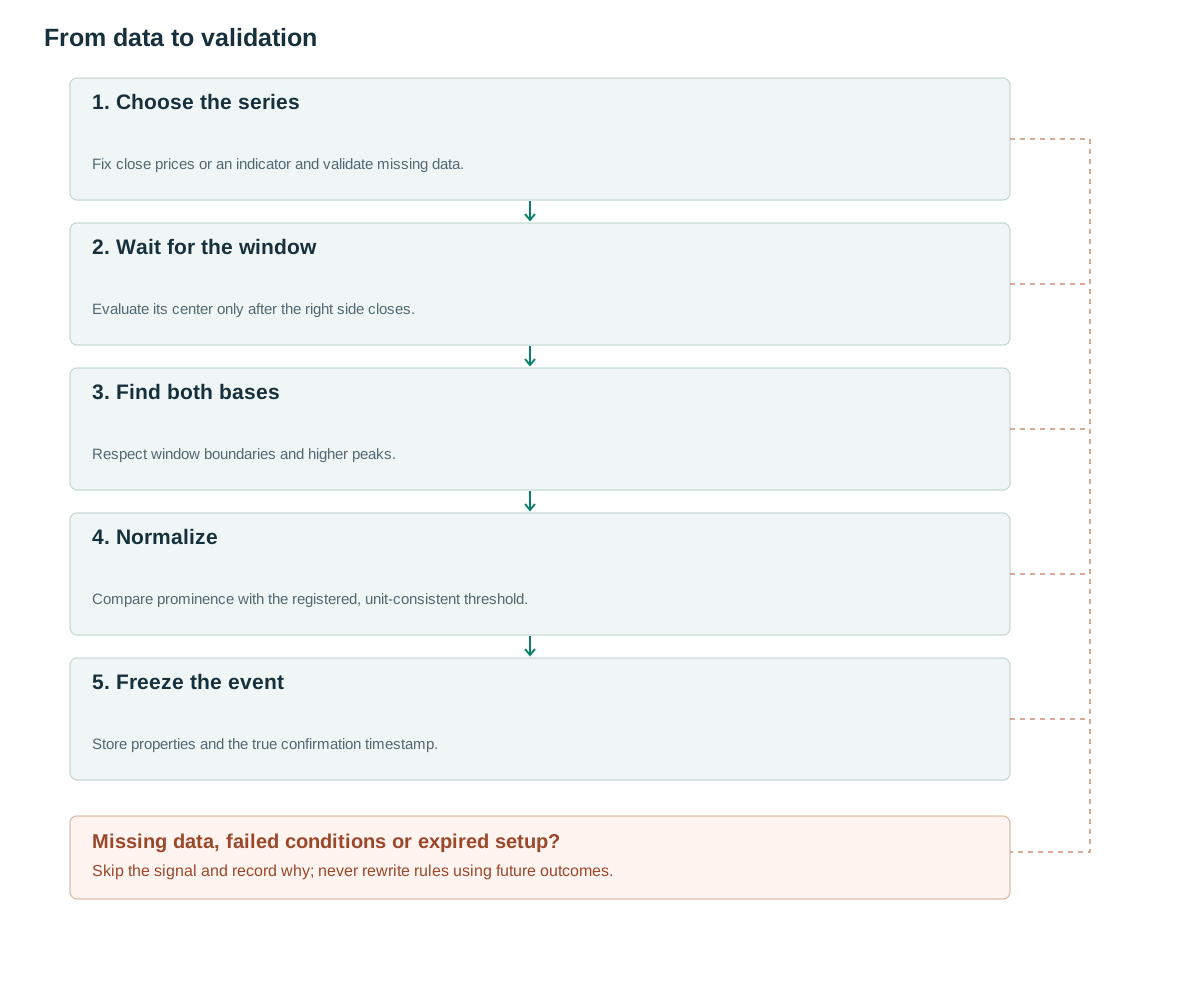
- Choose the seriesFix close prices or an indicator and validate missing data.
- Wait for the windowEvaluate its center only after the right side closes.
- Find both basesRespect window boundaries and higher peaks.
- NormalizeCompare prominence with the registered, unit-consistent threshold.
- Freeze the eventStore properties and the true confirmation timestamp.
A higher price is not necessarily a more prominent peak
A close at 120 above a surrounding base near 119.8 can be less structurally distinctive than a close at 105 above a base near 100. Absolute height depends on the instrument's nominal price. Prominence asks a different geometric question: how much does the candidate rise above the contour connecting its surrounding structure?
SciPy defines prominence using the higher of the two side bases [1]. Width is measured at a specified relative prominence height [2], while find_peaks exposes several separate filters [3]. These are numerical-series tools. Interpreting an accepted peak as resistance, distribution or a trading opportunity requires additional context and independent testing.
The intended benefit is a reproducible reduction in insignificant anchors. It is not a promise that a large prominence identifies a final top. A strong trend can generate prominent local peaks followed by still higher prices, and waiting for surrounding structure can leave little favorable reward-to-risk by the time an event is confirmed.
A local detector with a finite confirmation delay
The proposed baseline uses W=11 observations and radius h=5. At the close of t, evaluate only candidate i=t−5 inside i−5 through i+5. Require prominence of at least 1.5×ATR[i−1]. W=11 and 1.5 are experimental settings, not optimized values. ATR from before the candidate provides a fixed volatility reference already known by confirmation.
From the peak, examine each side until the window boundary or a higher peak limits the search. Find the minimum in each resulting interval, choose the higher base and subtract it from the candidate value. For troughs, apply the same geometry to negative close prices. Taking the lowest value across both sides would overstate prominence for a peak sitting on the shoulder of a larger structure.
The code restricts plateaus to a single observation. If flat tops are needed, define their representative timestamp and full confirmation policy as another version. NaN values must not silently become zeros because that would create artificial deep bases. A candidate at a window boundary lacks the required surrounding evidence and must not be treated as a centered peak.
h = 5; W = 2*h + 1
on_closed_bar(t):
    i = t - h
    if i-h < 0 or invalid_data(i-h, t): return
    x = close[i-h:t+1]
    candidates, _ = find_peaks(x, plateau_size=(1,1))
    if h not in candidates: return
    prominences, left_bases, right_bases = peak_prominences(x, [h], wlen=W)
    p = prominences[0]
    a = ATR[i-1]
    if a is not missing and isfinite(a) and a > 0 and p / a >= 1.5:
        emit_once(i, confirmed_at=t, prominence=p, window=W)
# Troughs: repeat on -close, preserving timestamps and ATR.
Height, threshold, prominence and width answer different questions
Height is the peak's value. Threshold measures its immediate difference from neighboring observations. Prominence uses a broader surrounding base. Width measures horizontal extent at a chosen vertical level. A broad rounded top can have small immediate neighbor differences while retaining substantial prominence; a high threshold requirement may inadvertently keep only one-bar spikes.
Distance filtering also needs a causal policy. Running find_peaks over the complete historical series and allowing a larger future peak to eliminate an earlier nearby peak can change the past selection. The baseline evaluates each centered candidate and applies no global distance pruning. A cooldown after published events is a possible alternative, but it favors chronological availability rather than the most impressive peak visible later.
Keep all measured properties in the event record even when a filter rejects the candidate. That makes it possible to diagnose which condition removed opportunities. Otherwise adding width and distance simultaneously can improve an aggregate statistic while leaving no clear explanation of whether the change came from shape, timing, or a different number of trades.
Numerical examples, rejected ripples and losing trades
Synthetic local segment: 100, 101, 103, 106, 104, 102, 103. Within exactly this illustrative segment, the left base is 100 and the right base is 102, so prominence is 4. With reference ATR=2, normalized prominence is 2 ATR and exceeds the proposed 1.5 threshold. The surrounding window still has to finish before this can be a published event.
Another segment, 108, 109, 110, 109.8, 109.7, contains a higher absolute peak but a higher side base of 109.7. Its local prominence is only 0.3; with ATR=1 it fails the same filter. These segments illustrate geometry rather than complete W=11 fixtures or evidence that one produces profitable trades and the other does not.
A trade can lose after a prominent high. Suppose confirmation permits a short, the next available fill is 101.8 and a structural stop sits at 106.2. Planned price risk is already 4.4 points. A rebound to 107 defeats the trade even though the detector correctly measured the earlier extreme. A projected target equal to prominence would itself be a separate hypothesis.
Add a higher neighboring peak just inside versus just outside the fixed window to test locality. The newly evaluated candidate's prominence may change between those datasets, but a previously published event from an unchanged prefix must not be rewritten. This distinguishes a deliberate window definition from accidental use of future structure.
Use prominence as an anchor feature before inventing an entry
One proposed use is to select anchors for double tops or resistance zones while leaving the trigger to a later event, such as a close below an intervening low. Freeze window_start, window_end, both bases, prominence, ATR_ref, detector version and confirmed_at with the candidate. These fields permit exact reconstruction of the decision.
An immediate post-confirmation entry needs its own stop, time exit, exposure limits and execution model. Prominence does not supply a natural guaranteed price target. Compare a prominence-based projection with a fixed-R target or time exit only within registered configurations; do not choose the exit separately for each attractive chart.
When the detector operates on RSI or another bounded indicator, its prominence is measured in indicator points. Dividing RSI prominence by price ATR mixes units. Use a dimensionally consistent normalization, or retain raw indicator points as a separately calibrated feature. The same warning applies when comparing log-price and ordinary-price detectors.
Let volume test a distinct contribution
Volume is absent from the prominence formula, so it can add a separate data feature, but this does not guarantee statistical independence. Save activity near the extreme and RVOL at the eventual trigger separately. High aggregate volume alone cannot identify institutional participation, and prominent peaks around news can coincide with expensive spreads.
Group observations by prominence/ATR and compare different RVOL ranges within those groups. This asks whether volume adds information beyond price amplitude rather than merely selecting larger moves. Use comparable session-time baselines for intraday assets, and fix venue and base-versus-quote-volume conventions for crypto.
Report how the volume filter changes signal count, average holding time and exposure. A higher average profit per filled trade can coexist with lower portfolio performance if the filter discards many useful opportunities. Missing volume must have an explicit unavailable-data policy rather than being interpreted as an extreme dry-up.
Validate geometry, stability and economic value separately
Fixtures should include a small peak nested beside a larger peak, flat plateaus, NaNs, window edges and closely spaced candidates. Check the exact base locations as well as the resulting prominence. If SciPy is used, record its version and any preprocessing; a centered smoothing filter adds its own future-data delay.
Measure the number of retained anchors, the fixed h-bar confirmation lag and the fraction of downstream patterns that are stale when their final anchor becomes available. Then evaluate net results on a locked test period with realistic costs and execution. A visually cleaner chart is not an economic metric.
Increasing W changes the definition of newly evaluated local structure. It must not modify already-published events belonging to the previous version. Compare nearby window sizes on development data, register the number of trials and report whether the extra filtering meaningfully improves net expectancy or risk after accounting for missed opportunities.
Common pitfalls
Confusing prominence with absolute height
A higher nominal price does not imply a more distinctive peak relative to its local base.
Pruning distances after seeing the whole series
A future peak can remove an earlier event. Use replay or a stated causal cooldown instead.
Smoothing without accounting for delay
A centered smoother uses later observations. Add that delay to the event's actual availability.
Checklist before using this method
Check each item after verifying it on your data. Progress is saved in this browser; it does not certify a profitable strategy.
Frequently asked questions
Is prominence better than an ordinary pivot?
It adds an amplitude-and-base criterion. Whether that helps depends on the detector's purpose and the out-of-sample performance of the strategy consuming its anchors.
Can prominence detect RSI peaks?
Yes, because RSI is a numerical series. The resulting units are RSI points, so price ATR is not a valid direct denominator.
Research sources
Each source supports the definition or evidence described beside it. The pseudocode, synthetic examples and proposed parameters require separate validation.
- scipy.signal.peak_prominencesSciPy. Read the base, wlen and algorithm definitions; this is numerical documentation, not financial research. Checked: .
- scipy.signal.peak_widthsSciPy. Read relative-prominence width measurement and interpolation behavior. Checked: .
- scipy.signal.find_peaksSciPy. Read filter definitions and distance handling. Checked: .
Related methods
Risk note
This content supports education and research design, not financial advice. Backtest is historical simulation, does not guarantee future performance and does not place real trades. Methods in this library are not automatically features available in the app. See methodology and learning center.
Validate rules before risking real capital
Check app support, data and individual simulated trades; advanced detectors may require a separate implementation.
Download Backtest on the App Store