Article contents
Evidence and scope
The author’s explanatory article and ebook metadata were reviewed. The linked video is a further-learning resource; unverified audio details are not used. These sources do not supply an independent trade log. The state machine below is an original proposal without a new backtest.
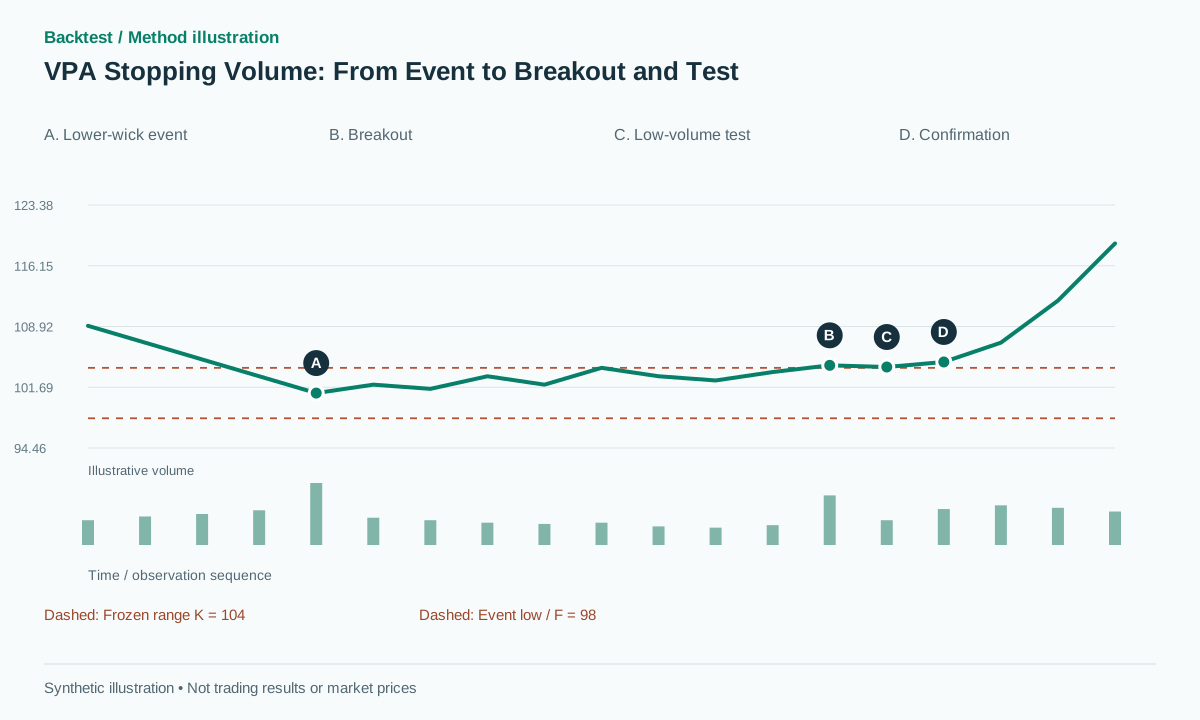 Open full-size illustration
Practical workflow
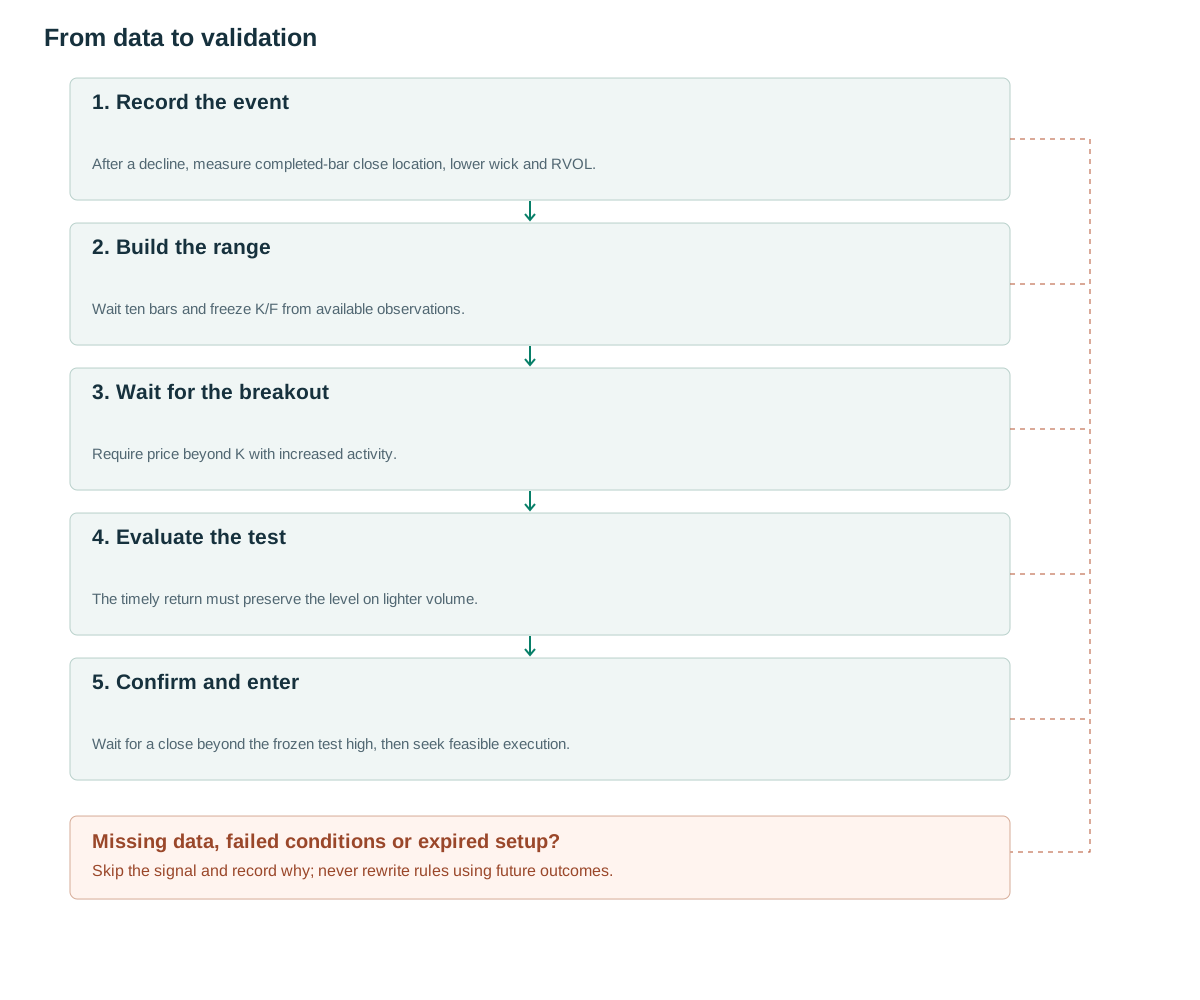
- Record the eventAfter a decline, measure completed-bar close location, lower wick and RVOL.
- Build the rangeWait ten bars and freeze K/F from available observations.
- Wait for the breakoutRequire price beyond K with increased activity.
- Evaluate the testThe timely return must preserve the level on lighter volume.
- Confirm and enterWait for a close beyond the frozen test high, then seek feasible execution.
What the structure tells us
Coulling describes stopping volume after a decline through observations such as high activity in a narrow candle or a long lower wick; it need not mark the final low. Subsequent congestion, lighter-volume tests and breakouts provide further context. The article does not prescribe one rigid setup that repeats identically. [1]
The listed ebook edition of A Complete Guide To Volume Price Analysis dates to 2024. [2] That edition date should not be confused with the book’s first publication. The VPA trend-management video introduction is another learning lead. [3] Our implementation converts observable ideas into a sequence without claiming to know whether a market maker is buying.
The practical hypothesis is that the market’s response after an unusually active decline may contain more information than the event candle alone. Requiring additional evidence also delays entry and removes opportunities. Those costs are part of the experiment, not inconveniences to be hidden by selecting only successful illustrations.
Rules using information already available
For event bar s, freeze A=ATR14[s−1]. Require a preceding decline C[s−1]−C[s−11]≤−2A. The event must have positive range H−L, RVOL20=V/median volume of the preceding twenty bars ≥2, close location CLV=(C−L)/(H−L)≥0.6 and lower-wick fraction (min(O,C)−L)/(H−L)≥0.4. This proposed lower-wick branch does not cover every stopping-volume form described by the author.
Wait exactly ten completed bars after s. Cancel if a low crosses below L[s]−0.2A. At c=s+10, freeze K as the highest high and F as the lowest low from s through c inclusive. During the next twenty bars, wait for a close crossing K+0.1A with RVOL20≥1.5. The breakout t must occur after the range has been frozen.
Find the first eligible test r within t+1 through t+5. Require low≤K+0.15A, close≥K−0.2A and mean volume from t+1 through r <0.7V[t]. Then wait for confirmation u within r+1 through r+3, with close>H[r]+0.1A. Freeze the test high before searching for confirmation. Cancel on close<K−0.2A, low<F−0.2A or the applicable deadline.
Apply each invalidation only in the state where its required levels exist. Before the range is frozen, use the event-low rule; after freezing, use low<F−0.2A. Only after breakout does close<K−0.2A invalidate the breakout thesis. Applying that close test while building the range or waiting for its break would incorrectly cancel ordinary prices inside the base.
DECLINE -> EVENT when proposed stopping criteria pass
EVENT -> BUILD_RANGE for exactly 10 completed bars
BUILD_RANGE -> WAIT_BREAKOUT: freeze K,F,A
WAIT_BREAKOUT -> WAIT_TEST on qualifying close beyond K
WAIT_TEST -> WAIT_CONFIRM on first qualifying low-volume test
WAIT_CONFIRM -> SIGNAL on close above frozen test_high+0.1*A
SIGNAL: enter next feasible event; stop=F-0.2*A
R=entry-stop; target=entry+2*R; time_stop=20 bars
Any state: invalidate only from information then available; never rewrite prior signals.
Giving volume a specific job
High volume at the event and low volume during the test play opposite roles. The first identifies unusual activity during a decline; the second asks whether a return toward the range boundary occurs with less activity. Both remain observable features. Neither proves absorption, participant identity or how much supply is left.
Using the mean over the entire observed test interval avoids selecting one conveniently quiet candle. Record how many bars the interval contains. For intraday research, normalize against comparable session slots in a separately named variant. A news-driven breakout with enormous volume makes the 0.7 ratio easy to satisfy, so examine event and non-event groups separately.
The baseline uses a median for historical RVOL because one unusually active earlier bar should not dominate the denominator. That choice itself should be tested against a mean-based version. Do not replace a missing or zero denominator with an arbitrary favorable value; flag the candidate as unavailable under the declared data policy.
Numerical examples and failure cases
Synthetic example: A=1 and event OHLC is O=101, H=102, L=98, C=101. Both CLV and the lower-wick fraction equal 0.75, while RVOL is 2.5. Assume the preceding-decline condition also holds. Ten bars later the frozen range has K=104 and F=98. The breakout closes at 104.3 with volume 200.
The first eligible test has low 103.9, high 104.4 and close 104.1. Mean volume over the observed test interval is 100, below 140. A later confirmation closes at 104.7, above 104.5. An executable entry at 104.8 gives protection at 97.8, R=7 and a 2R target at 118.8.
A synthetic successful path reaches 118.8 before protection and the time exit. A pre-entry failure instead has the test close at 103.6, below 103.8, and must cancel. A later recovery cannot turn that canceled sequence into a successful test. In a post-entry failure, a stop gap fills at 97.4 and loses 7.4 per unit before costs, exceeding planned R.
The illustration compresses the range-building interval for readability. Its close line does not show the event’s low of 98. Use the stated OHLC values to verify wick arithmetic and the full ten-bar state timing, rather than treating the number of drawn points as executable data.
Entry, invalidation and exits
This conservative sequence can enter late and leave a wide stop below the whole range. Measure that tradeoff explicitly. A stop beneath the test candle is a different strategy, not a correction to make after seeing the result. Direct breakout entry and entry immediately after the event are also useful controls with distinct information requirements.
Size from monetary risk, notional limits and total exposure to correlated positions. Event-driven gaps can produce losses beyond the planned stop distance. The fixed 2R target and twenty-bar holding limit are proposed baseline exits; they are not attributed to Coulling, and the synthetic example is not a historical performance record.
Before an unfilled entry, check that its feasible price still produces a positive, affordable risk distance. After an order has filled, retain the actual execution even if it violates an intended limit; any reduction or emergency exit has its own cost. The target formula is fixed in advance, but its numeric level is finalized from the actual fill.
Testing incremental value
Run a sequence of ablations: event only, event plus range, direct breakout, and breakout plus test. Keep the universe and execution-cost assumptions consistent, and record opportunities lost at each stage. A longer confirmation sequence can raise win rate while reducing net expectancy or total return; win rate alone does not establish improvement.
Store every state transition, frozen K/F, test duration, volume baseline and cancellation reason. Split training and evaluation chronologically and use an appropriate separation when overlapping candidates share observations. Conclusions should follow unseen outcomes rather than a story that all remaining supply has been absorbed.
Deterministic cases should cover a zero-range event, cancellation on the tenth building bar, a breakout on the first eligible later bar, a test arriving after its five-bar deadline and confirmation arriving after three bars. A second attractive test must not replace the first qualifying test after the first one fails. Candidate identity and state history should survive replay unchanged.
Common pitfalls
A volume spike treated as the bottom
High activity can accompany further decline; the event is not yet an entry signal.
A range borrowed from the future
Do not enter at the event and use ten subsequent bars to claim the range was already established.
A test selected by its outcome
Use the first qualifying test and fixed deadlines, not the last pullback before an advance.
Checklist before using this method
Check each item after verifying it on your data. Progress is saved in this browser; it does not certify a profitable strategy.
Frequently asked questions
Must the event be a textbook hammer?
Not for the author’s broader approach. This article selects a lower-wick branch to make one detector explicit; a narrow-range branch can be evaluated separately.
Why require so many confirmations?
They separate the initial event from later responses. Delay and missed trades are measurable costs, so additional steps are not assumed to be beneficial.
Research sources
Each source supports the definition or evidence described beside it. The pseudocode, synthetic examples and proposed parameters require separate validation.
- Anna Coulling: Getting in using volume price analysisAnna Coulling. Author article dated August 29, 2014, discussing stopping volume, congestion, tests and breakouts. Checked: .
- A Complete Guide To Volume Price AnalysisMarinablu International Ltd / Google Books. Metadata for the 2024 ebook edition; its date is not treated as the first publication date. Checked: .
- Learn how to stay in a trend using volume price analysisAnna Coulling. The video introduction was reviewed; unverified audio details are not used as evidence. Checked: .
Related methods
Risk note
This content supports education and research design, not financial advice. Backtest is historical simulation, does not guarantee future performance and does not place real trades. Methods in this library are not automatically features available in the app. See methodology and learning center.
Validate rules before risking real capital
Check app support, data and individual simulated trades; advanced detectors may require a separate implementation.
Download Backtest on the App Store