Article contents
Evidence and scope
Relevant TradeGuider slides and an indexed excerpt from a publisher-hosted book were reviewed. No independent portfolio result for this complete rule sequence was established. ATR thresholds, the rejection detector, expiry and exits below are original research additions.
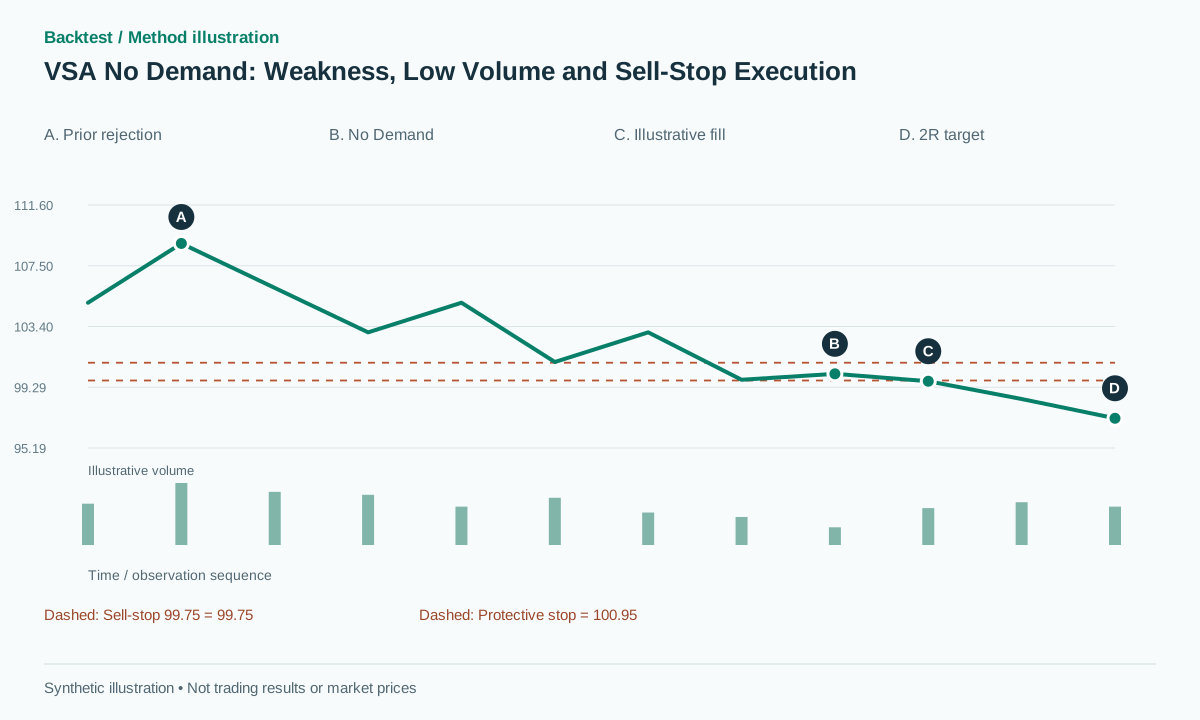 Open full-size illustration
Practical workflow
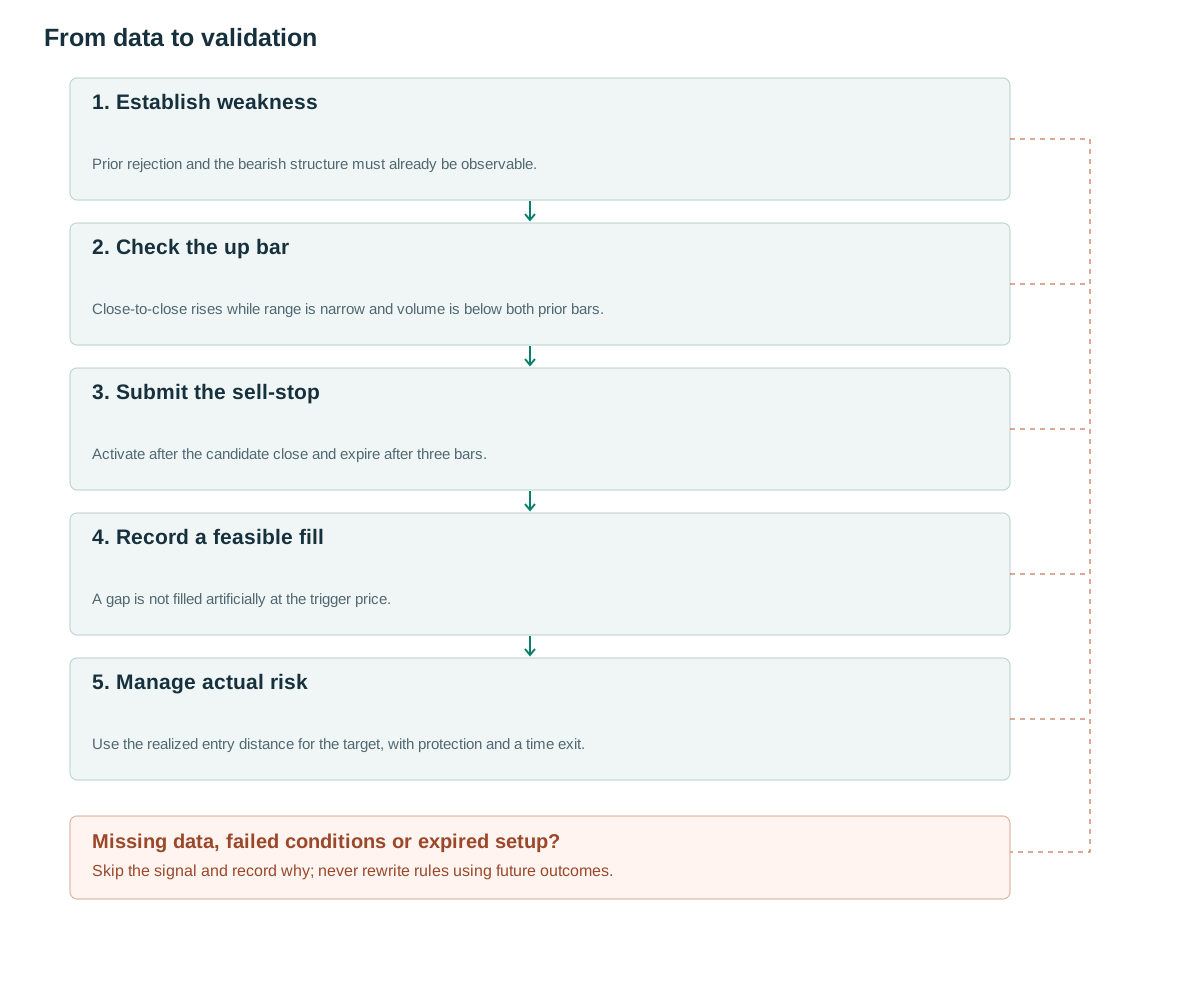
- Establish weaknessPrior rejection and the bearish structure must already be observable.
- Check the up barClose-to-close rises while range is narrow and volume is below both prior bars.
- Submit the sell-stopActivate after the candidate close and expire after three bars.
- Record a feasible fillA gap is not filled artificially at the trigger price.
- Manage actual riskUse the realized entry distance for the target, with protection and a time exit.
What the structure tells us
The slides describe No Demand in a downtrend after weakness: an up bar has volume below the two preceding bars, followed by a sell-stop below its low. They caution against shorting No Demand simply because it appears in an uptrend. [1] Here, “up bar” means close above the previous close, not necessarily close above its own open.
The Gavin Holmes excerpt adds a narrow spread and confirming context. [2] In VSA terminology, spread here means the candle’s high minus low, not the bid–ask spread. Explanations involving professional participants are interpretations; OHLCV alone does not identify the traders involved or establish their intentions.
The proposed experiment tests a measurable conjunction: an already weak structure, a small upward close-to-close move on relatively little activity, and a subsequent downward trigger. A low-volume candle by itself is insufficient. This separation helps distinguish a contextual setup from an after-the-fact narrative about who supposedly bought or sold.
Rules using information already available
Define proposed background weakness using the twenty bars before candidate n. At least one bar s must reject an already known rolling high: level=max high of the twenty bars preceding s, H[s]>level+b and C[s]<level. Require two confirmed lower swing highs and a swing low already broken by a close. Three-bar left/right pivots are usable only from their confirmation timestamps.
The candidate must satisfy C[n]>C[n−1], V[n]<min(V[n−1],V[n−2]) and H[n]−L[n]<0.7A, where A=ATR14[n−1]. Freeze b=max(2 ticks,0.1A). After n closes, place a sell-stop at L[n]−b with protection at H[n]+b. The order is valid for the following three bars. These numerical thresholds and the background detector are research proposals.
If a cancellation condition becomes known before an unfilled order executes, cancellation can be modeled at that time. The final high or close of a bar cannot justify canceling a fill that occurred earlier within it. OHLC does not reveal that ordering; use finer data or a predeclared conservative convention.
The rejection comparison uses the candidate’s frozen buffer in this baseline when evaluating prior observations. This remains causal because all observations are available at candidate creation. A variant using each rejection bar’s own prior ATR must be named separately. In either version, never include s itself in its rolling resistance level.
on close n:
  if prior_rejection and bearish_structure and up_bar and V[n]<min(V[n-1],V[n-2]) and range[n]<0.7*A:
    place SELL_STOP trigger=L[n]-b, protection=H[n]+b
    valid_from=next_event; expires=close[n+3]
on actual trigger/fill:
  entry=executable_price; R=protection-entry
  if R>0: target=entry-2*R; time_stop=20 bars
  if fill violates hard_risk_limit: reduce/exit next feasible event and record cost
# Never erase a fill because the gap was unfavorable.
Giving volume a specific job
The requirement to be below two preceding bars is a local comparison. It may pass simply because both previous bars contained unusual news volume, even when current activity remains above normal. Store same-time RVOL or daily RVOL20 as additional diagnostics, while preserving the original two-bar definition as a distinct feature.
Run experiments with the same background and execution policy: remove the volume rule, use the two-bar condition, replace it with low RVOL, and combine them. If the filter mainly selects lunchtime bars, an apparent result may reflect session seasonality and different spreads rather than information about demand.
Volume describes completed activity, not an absence of buyers. Every matched trade has two sides. A low-volume upward move may reflect thin offers, a pause, missing data or a genuine reduction in participation. The detector should record what it observes and let the subsequent outcome distribution test its usefulness.
Numerical examples and failure cases
Synthetic candidate: the preceding close is 99.8. Bar n has open 100.5, high 100.8, low 99.9 and close 100.2. It is a red candle, yet it is an up bar because 100.2>99.8. With A=1.5, its range of 0.9 is below 1.05. Volume is 60,000 versus 95,000 and 110,000 on the preceding bars.
Assuming the prior weakness conditions also pass, b=0.15, the sell-stop trigger is 99.75 and protection is 100.95. A feasible fill at 99.7 gives R=1.25 and a 2R target of 97.2. In the synthetic successful path, price reaches that target before protection, earning 2R before costs.
In the failure case, a gap fills the entry lower at 98.8. Actual R is now 2.15 and the recomputed target is 94.5. A subsequent protective fill at 101.1 loses 2.3 per unit. Reporting entry at 99.75 or deleting the order after seeing the gap would manufacture favorable execution.
An unfilled order is a third legitimate outcome. If the next three bars never reach the trigger, expire it at the declared close and record zero exposure. Do not count that candidate as a winning trade because price subsequently falls after the order has ceased to exist.
Entry, invalidation and exits
The sell-stop is submitted after the candidate closes and can fill only from the next executable event. The proposed 2R target uses the actual fill price, and the time exit is twenty holding bars. A hard risk limit breached by a gap may require reducing or closing the position, but that additional execution and its cost remain part of the record.
Protection above the nearest swing high instead of above the No Demand bar creates another strategy, usually with a different risk distance. For equity shorts, verify borrow availability and loan fees; perpetual contracts may incur funding. A correctly shaped candle without feasible execution is not a perfectly filled historical trade.
When entry, protection and target are all touched within one OHLC bar, the order of events matters. Resolve it with finer-grained event data only if those data are genuinely available; otherwise retain a conservative ambiguity rule and report how many trades it affects. Never select the favorable path separately for each trade.
Testing incremental value
The control shorts breakdowns of all narrow up bars within the same bearish context without considering volume. Add prior rejection, the two-bar volume rule and RVOL separately. Retain expired orders and rejected candidates, not just orders that were followed by a decline.
Report net expectancy, drawdown, fill rate, gap slippage and sensitivity to 0.7ATR and the three-bar waiting window. If the data contain only OHLC, disclose the intrabar convention. The reviewed material does not justify assigning a fixed win rate or independently established profit to this configuration.
Unit cases should include a red up bar, a green down bar, equal volume on one preceding bar, a pivot not yet confirmed, a gap below the trigger and a cancellation learned after a fill. Strict comparisons matter: equal volume fails the stated lower-than condition. Replay must preserve both order activation and cancellation timestamps.
Common pitfalls
No Demand inside an uptrend
Without the required context, low activity may be an ordinary pause in an advancing market.
Green candles substituted for up bars
The definitions differ: a red candle can still close above the preceding bar.
A final close cancels an earlier fill
That uses future information; model intrabar events or apply a conservative ordering convention.
Checklist before using this method
Check each item after verifying it on your data. Progress is saved in this browser; it does not certify a profitable strategy.
Frequently asked questions
Does low volume mean there are no buyers?
No. It means activity is low under the specified comparison. Every executed trade still has both a buyer and a seller.
Must the next bar close lower?
A separate next-close confirmation variant can be tested. This article uses a sell-stop after No Demand, following the slide’s order concept, which has different timing.
Research sources
Each source supports the definition or evidence described beside it. The pseudocode, synthetic examples and proposed parameters require separate validation.
- VSA Signs of Weakness — Tom Williams and Gavin HolmesTradeGuider. Relevant No Demand and background sections read on physical PDF pages 20 and 29–33 of the 49-page document, counting the first page as 1. Checked: .
- Trading in the Shadow of the Smart Money — Gavin HolmesTradeGuider. Indexed excerpt around page 80 on up bars, narrow range and confirmation; the full book was not reviewed. Checked: .
- TradingView: RepaintingTradingView. Documentation on repainting and historical information availability; used for causal timing discipline. Checked: .
Related methods
Risk note
This content supports education and research design, not financial advice. Backtest is historical simulation, does not guarantee future performance and does not place real trades. Methods in this library are not automatically features available in the app. See methodology and learning center.
Validate rules before risking real capital
Check app support, data and individual simulated trades; advanced detectors may require a separate implementation.
Download Backtest on the App Store